
A faster MLA decode kernel for Kimi-K2.7-Code on MI300X
We serve Kimi-K2.7-Code on AMD MI300X. The stock attention kernel wasn't a good fit for how we run it, so we wrote our own: 1.9× to 22.9× faster across the shapes we serve, which lands as +24% token generation in production.
Here's what was wrong, and what we built.
Background: decode reads a lot and computes very little
Kimi uses MLA (Multi-head Latent Attention). During decode — the phase where the model emits tokens one at a time — attention is essentially a streaming read. Each cached token is one 576-byte row, and to produce a single new token the kernel reads the entire cache.
There's very little arithmetic per byte. So decode time should be set by how fast you can move the cache, and by how much of the GPU you can put to work moving it.
Why the stock kernel didn't fit
SGLang doesn't implement this kernel. It calls aiter, AMD's kernel library, which ships a catalog of hand-written assembly kernels and picks one matching your model's shape.
Here's the relevant slice of that catalog. The column that matters is qSeqLen — how many query rows the kernel processes at once:
query   cache   heads   qSeqLen    kernel
fp8     fp8     16      1          mla_a8w8_qh16_qseqlen1...
fp8     fp8     16      2          mla_a8w8_qh16_qseqlen2...
fp8     fp8     16      4          mla_a8w8_qh64_qseqlen4...

bf16    fp8     16      4          mla_a16w8_qh16_m16x4...     <- the only one
Two precision families. One takes the query in fp8; the other takes it in bf16 with the KV cache in fp8 — that second combination is what we run.
The fp8-query family has variants for 1, 2, and 4 query rows. The bf16-query/fp8-cache family has only the 4-row version.
Ordinary decode processes one query row per request. One token in, one token out. So every step called a kernel built for 4 rows, filled one, and padded the rest. The name spells out the geometry: m16x4 is 16 heads × 4 query rows = a 64-row tile, of which we filled 16. Three quarters of every matrix multiply ran on padding.
We confirmed it with a profiler: the kernel we were running read 1.190 GB, and a structurally similar kernel that isn't padding read 1.188 GB — the same data, within 0.2%. Same bytes in, 2.4× the time. The gap was compute spent multiplying zeros.
The second issue was parallelism. Aiter's decode barely divides a single request's cache across the GPU, so at low concurrency it left most of the machine idle — occupying 16 of 304 compute units. Its runtime was nearly identical for 1 request and for 8.
Neither of these is a defect in AMD's kernel. It's well-written and does what it says. We were simply running a shape it wasn't built for. (There is a case where 4 query rows is right: speculative decoding, where the model proposes several tokens at once. We don't run it.)
What we built
A decode kernel shaped for the workload we actually have:
One query row per request — no padding, none of the wasted matrix work.
Split the cache across the GPU. Rather than tying parallelism to the number of attention heads, we divide each request's cache into many chunks, compute partial attention over each in a separate workgroup, and merge the partials at the end. At low concurrency this is what makes the difference — one request can occupy 384 workgroups instead of 16, so a single user gets the whole GPU instead of 5% of it. The planner picks the split per shape, so the same kernel stays efficient as batch grows and the split is no longer needed.
Separate loading from math. Some waves do nothing but stream data in from memory; the rest do nothing but compute. Decoupled, the loaders keep memory busy while the math never sits waiting.
Keep the compute waves out of each other's way. Each wave owns a complete unit of work rather than a slice of one, so producing a result needs no exchange with its neighbours. Splitting work the other way costs a round through shared memory on every tile; structured this way, that traffic is 8× smaller and the kernel uses less shared memory as well.
Results
Microseconds, lower is better [1]:
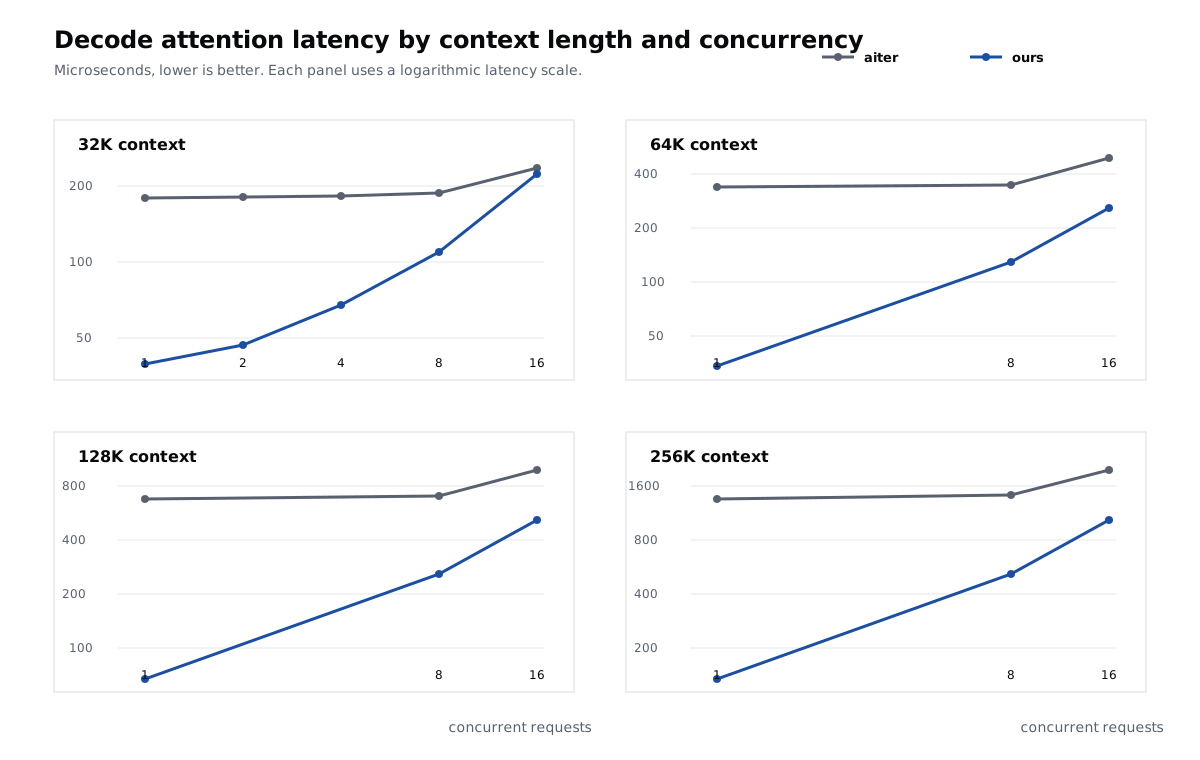
Figure 1. Decode attention latency across the displayed benchmark shapes. Each panel uses a logarithmic latency scale; lower is better.
(abridged; 20 shapes measured, geometric mean 5.25×)
The gains are largest where the cache split does the most work — a single request at 256K context runs 22.9× faster, because we fill the GPU and aiter doesn't. And at 16 concurrent requests, where there's enough traffic to fill the machine either way, we still hold a consistent ~2× from not doing the padded math: 1.93×, 1.99×, 1.97×, 1.94× across the four context lengths.
The cleanest way to see the difference is to group runs by total work — context × concurrency — and compare arrangements that process exactly the same amount of cached data:
| same total data | ours | aiter |
|---|---|---|
| 32K×8, 64K×4, 128K×2, 256K×1 | 59.09 – 59.21 us (1.00× spread) | 190.5 – 1356.6 us (7.12× spread) |
| 64K×16, 128K×8, 256K×4 | 225.5 – 229.8 us (1.02×) | 449.9 – 1365.9 us (3.04×) |
| 128K×16, 256K×8 | 451.4 – 455.8 us (1.01×) | 890.3 – 1427.4 us (1.60×) |
Our runtime is a pure function of how much data it processes — one long request or eight short ones, same total bytes, same time to within a fifth of a percent. That's what a correctly-shaped kernel looks like: cost tracks work, and nothing else. Aiter varies 7× on identical work, because its runtime tracks the depth of a single request rather than the total.
What it's worth in production
Kernel benchmarks aren't product improvements, so we measured the actual server: production configuration, real prompts, 16 concurrent requests at ~50k tokens of context, identical inputs, changing only the attention kernel.
| token generation | vs. before | |
|---|---|---|
| before | 341 tok/s | — |
| after | 424 tok/s | +24% |
Attention is about 37% of decode time — the mixture-of-experts layers, sampling, and inter-GPU communication are untouched by this work — so a 2× kernel at serving batch lands as +24% on generation. End-to-end on this particular workload users saw about 8%, because much of the wall time goes to processing the prompt, which this kernel doesn't touch. Long-output agentic coding sits nearer 24%; long-prompt-short-answer nearer 8%.
The gain scales with context length and concurrency, since those set attention's share of the work.
The general lesson
Nothing here was broken. AMD's kernel is well-written, SGLang calls it correctly, every layer behaved. The waste lived in the seam: we ran a shape nobody had written a specialized kernel for, and the nearest available one was built for a different workload. The system degraded silently and correctly into doing four times the necessary work on a fraction of the GPU.
If you run inference on a configuration that isn't the most common one, check which kernels you're actually landing on. Dump the kernel names from a profiler and read them — they usually encode the shape they were built for right in the name. Ours said m16x4 the entire time.
MI300X (CDNA3, 304 CUs), ROCm 7.2, tensor-parallel 4, bf16 query, fp8 KV cache, no speculative decoding.